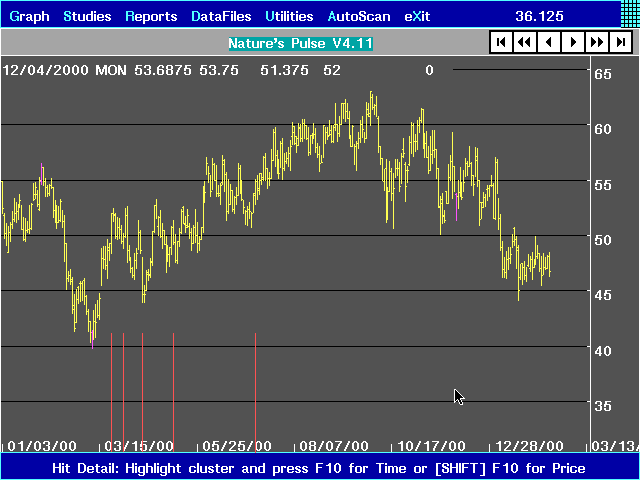
This is an example of the *C* Cycle.
In this study, you select two points. They can be highs, lows or any two bars you wish. Then you apply a multiplier file to this, and it projects the future bars based on the time between the two selected points.
Here we show a chart of American Express selecting the high on February 1, 2000 and the low on March 9, 2000. Then we applied a multiplier file with the values 1.382, 1.618, 2, 2.618, and 4.236. Again, notice the turning points that fell around these ratios.
This example was done using past history, and certainly when the price or time projections carry past the existing time shown, the future turning points are highlighted for your easy review.
By the way, *C* and *D* cycle studies can be performed using time OR price!

