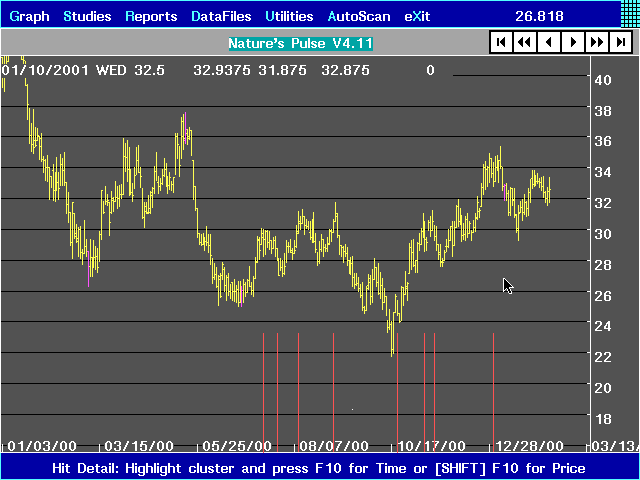
This is an example of the *E* Cycle.
The *E* Cycle is a little different than the *C* cycle, in that you select two points to measure between, but then select the time points from which to apply the multiplier file from.
Here we have selected the same Boise Cascade stock using the lows in March, 2000 and June 2000, then told Nature’s Pulse to use the May, 2000 high and the June, 2000 low as calculation points. We then applied the same Fibonacci multiplier ratio file of 1.382, 1.618, and 2, to the chart.
And you see how this projected nearly every turn into the future, including the small double high in November, 2000. In one of the next examples, you will see how this January, 2001 high was also confirmed using time and price accordions.

